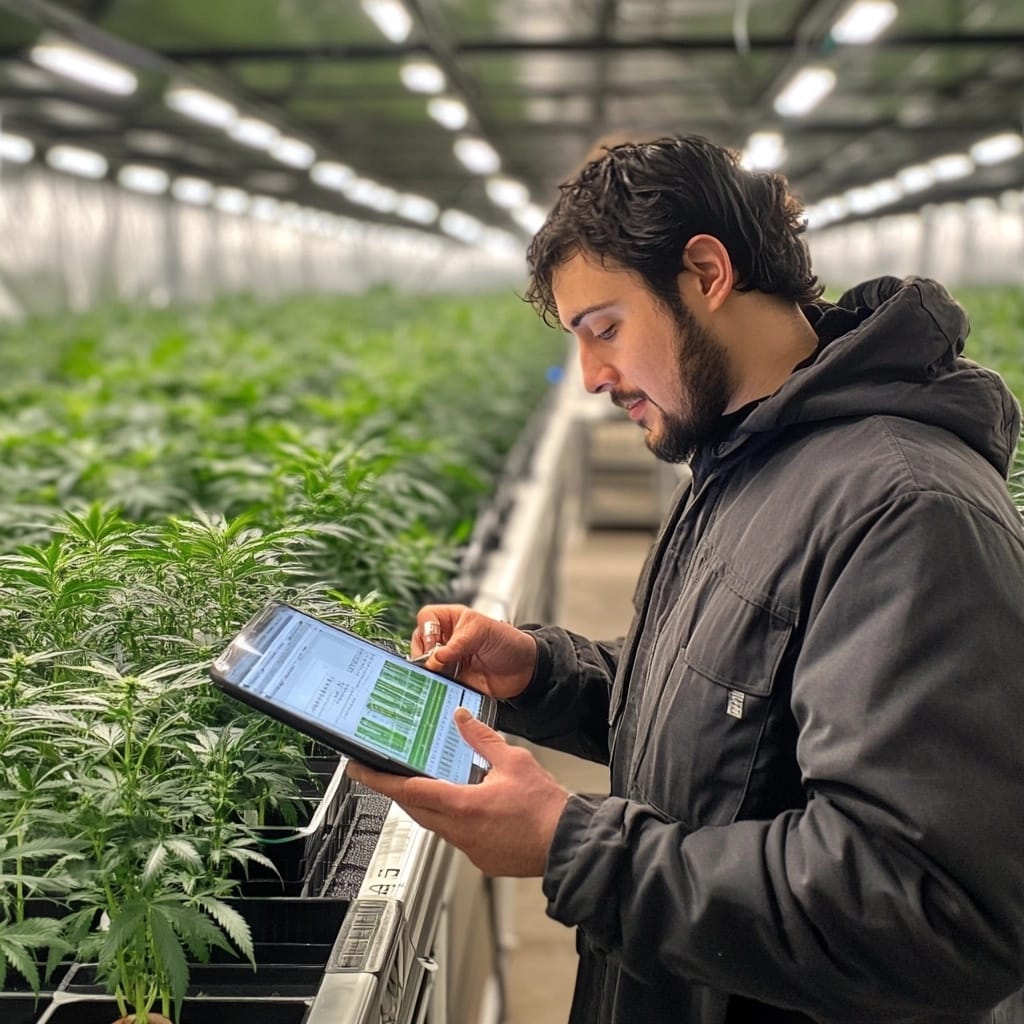
New Features in the Grow Ops App – Work in Progress!
We've added a Harvested Lots page to track key data like wet/dry weight and testing results, plus a Trash Page for dead lots. Simplified charts now focus on humidity, temperature, and light. The new AI Analytics feature will offer predictive insights and automated reports soon!

Hey fellow growers and tech enthusiasts! I’ve been heads-down pushing updates to the Grow Ops app, and while some of this is still a work in progress, I figured why not get it up into the cloud for some early feedback? After all, the sooner we spot potential pitfalls, the quicker we can course-correct if we’re steering off track with features.
Harvested Lots Page – Let’s Track the Final Product
First up, I’ve added a new Harvested Lots page. This is where all the harvested batches from your grow operations will live. The goal here is to go beyond just saying, “Hey, this batch is harvested.” We’re attaching all the important metadata that follows that harvested lot: wet weight, dry weight, and testing results from third parties (if you’re sending out batches for analysis). Think of it as your go-to spot for all the data about your final product. And here’s the kicker: once a lot is placed here, it’s essentially locked down – you won’t be able to modify it.
That said, I’m not going all “immutable” on you. We track history in the app, so if you absolutely need to adjust something, you’ll still have a record of every change. But generally, if it’s harvested, it’s in the books.
Trash Page – Dead Lots Stay Dead
In addition, we now have a Trash Page for dead lots. If something goes wrong during the grow, and you need to discard a lot, it lands here. Just like the Harvested Lots page, lots in the trash can’t be modified anymore. Once something is marked as trashed, it’s a one-way trip. No resurrection from the dead here, unless...we somehow turn it into compost! (Now that would be a magical product!)
Simplified Charts – Focus on the Key Metrics
For those tracking environmental factors with sensors, I’ve simplified the data charts on the Location Page. We’re now honing in on the basics: humidity, temperature, and light exposure. Why? Because that’s what my prototype sensor is tracking, and I want to ensure the app’s focus is on the most important metrics that growers care about. The goal is simple, useful data that helps you manage your environment effectively. And this is just the beginning—future sensors can plug in more metrics down the road.
AI Analytics Button – Let the Fun Begin
One of the most exciting additions is the new AI Analytics button. This feature is going to be fun to implement. The idea is to leverage AI in ways that make your data more actionable. Here’s how I’m thinking about it:
- Predictive Insights: Based on historical data from your locations and lots, the AI could forecast things like optimal harvest windows, potential growth issues (like mold or humidity spikes), or even suggest tweaks in your environment to maximize yield. It could use pattern recognition to spot anomalies that the human eye might miss.
- User Feedback Loop: What if you could ask the AI questions like, “What’s the best temp range for this strain?” or “How does humidity impact my current grow?” The AI could generate answers based on your data, provide general best practices, or offer insights from trends seen across other grows.
- Report Generation: We’re also exploring the ability to generate PDF reports for compliance, investors, or just personal records. With the data collected, the AI could automatically put together professional-looking reports with charts, summaries, and even recommendations based on what it’s seeing in the data.
Why AI Matters in Grow Ops
Feeding AI data from the sensors tracking humidity, temperature, and light exposure opens up so many possibilities. The AI can analyze all this information, look for correlations, and report back with useful insights. Imagine it telling you when conditions are starting to shift outside optimal ranges before you even notice. That kind of automated insight can save crops, time, and ultimately money.
There’s also potential for generating trend reports over time. The more data you feed it, the more accurate and useful its predictions and feedback will become. Plus, wouldn’t it be cool to have the AI tell you which of your past grows performed the best and why? All of this can help fine-tune your processes and ensure your operations are running as efficiently as possible.
What’s Next?
Stay tuned! We’ve got a lot more features cooking in the background, and I’m stoked to share them with you as they roll out. For now, let me know what you think of the new pages and the simplified charts. As always, feedback is welcome!
Until next time, happy growing! 🌱
